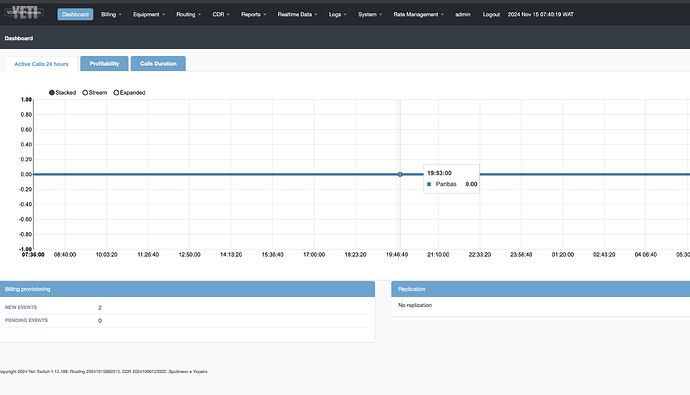
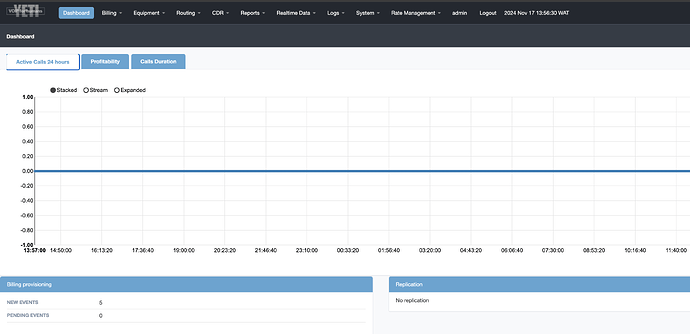
My dashboard shows empty. I mean the “Active calls 24hours and Profitability” Does not show any readings. what is the problem.
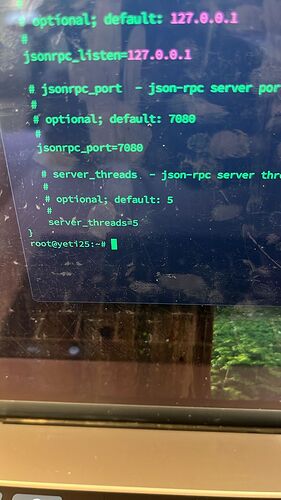
you have to check if rpc endpoint is correct and if your node respond on rpc requests.
rpc endpoint is correct on both the sems and web it is set at 127.0.0.1:7080. It was after this was done, It started displaying active calls via the Realtime Data Tab. But nothing yet on the dashboard.
Hi Dmitry I still have not been able to fix this please
nothing changed there - you have to check if rpc endpoint is correct and if your node respond on rpc requests.
Screenshot you provided is not related to sems configuration - sems config has other format. see SEMS node installation — Yeti documentation
Config looks ok. Check yeti-scheduler logs for errors.
1 Like


