Performance Improvements for YETI-SWITCH

Hello Team
I installed SEMS on a 28 Core CPU (56 Threads).

SEMS is rejecting about 25% of the calls with 500 Server Error and this rejection is not captured on the CDR (seems SEMS does this based on the CPS).

I can see that the more the thread value in sems.conf (say 8 x No. of threads), the more the 500 Server Error limiting the concurrent calls.

The less the thread value in sems.conf (say set at 56 which is the same No. of threads), the less the 500 Server Error but the more the routing delay, resulting in high PDD.

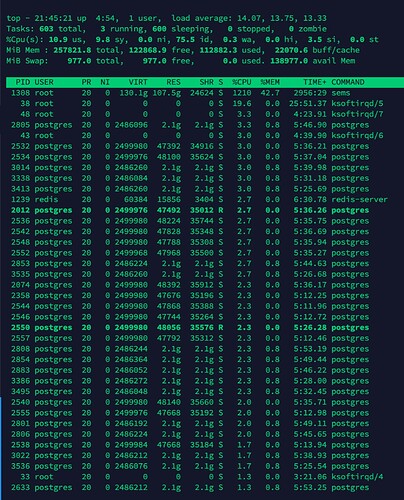
However, top shows that I am only using the equivalent of about 13 threads of 56. Also, a lot of RAM is free. Please is there anything I could do to get better performance (utilize the resources more fully)?

first you have to identify where bottleneck is. Also there is no thread value in sems.conf There are multiple different threads configuraton and it is not clear what exactly you changing.

post your sems.conf. What amount of calls you trying to handle(cc and CPS) ?

Looking at handling up to 7000 CC at 150 CPS.

general {
    daemon = yes
    stderr = no
    syslog_loglevel = 2
    syslog_facility = LOCAL0

    node_id = 8

    shutdown_mode {
        code = 508
        reason = "Yeti node in shutdown mode"
        allow_uac = true
    }

     session_limit {
         limit = 12000
         code = 509
         reason = "Node overloaded"
     }

    media_processor_threads = 224
    rtp_receiver_threads = 224
    session_processor_threads = 224
    sip_udp_server_threads = 224
    sip_tcp_server_threads = 224

    dead_rtp_time=30

    default_bl_ttl=0

    symmetric_rtp_mode = packets
    symmetric_rtp_packets = 20
}


signaling-interfaces {
    interface input {
        default-media-interface = input
        ip4 {
            sip-udp {
                public-address = 1.1.1.1
                address = 1.1.1.1
                port = 5060
                use-raw-sockets = off
            }
            sip-tcp {
                public-address = 1.1.1.1
                address = 1.1.1.1
                port = 6060
                connect-timeout = 2000
                static-client-port = on
                idle-timeout=900000
                use-raw-sockets = off
            }
        }
    }
}

media-interfaces {
    interface input {
        ip4 {
            rtp {
                public-address = 1.1.1.1
                address = 1.1.1.1
                low-port = 12000
                high-port = 32000
                dscp = 46
                use-raw-sockets = off
            }
        }
    }
}

modules {
    module "di_log"{}
    module "mp3"{}
    module "opus"{}
    module "wav"{}
    module "gsm"{}
    module "ilbc"{}
    module "adpcm"{}
    module "l16"{}
    module "g722"{}
    module "g729bcg"{}

    module "registrar_client" {}
    module "sctp_bus"{}
    module "http_client"{}
    module "session_timer"{}
    module "jsonrpc"{
        listen{
            address = 127.0.0.1
            port = 7080
        }
        server_threads=4
    }

    module-global "uac_auth" { }

    module "yeti" {
        management {
            address = 127.0.0.1
            port = 4444
            timeout = 60000
        }
        core_options_handling = yes
    }
}

routing {
    application = yeti
}

this is definitely wrong. these numbers should correlate with CPU cores count

also looks like you using some old verion

Hi Dmitry

media_processor_threads = 56
rtp_receiver_threads = 56
session_processor_threads = 56
sip_udp_server_threads = 56
sip_tcp_server_threads = 56

When threads are set to 56 for example, I start to see very high routing delays happening. Delay can get to as high as 15 to 30 sec.
Is there a way to prevent this routing delay?

True I am using v1.10
I had difficulties upgrading to v1.11 as I ran into issues here:

/usr/lib/postgresql/13/bin/pg_resetwal -e 1 /var/lib/postgresql/13/cdr

it depends what cause of this problem. It may be database performance.

OK, I will take it down to 56 and monitor logs more closely.

Any ideas on how to go about identifying the bottleneck?

Thanks for all your response.

As you may notice from the screenshot of the top command, I see ksoftirqd, indicating some queueing process.

It indicating network processing. it is not related to any queueing.

@EAfang check PM

you could try to enable query logging in database and check routing query duration

107Gb ram usage also is not normal for SEMS. It should consume 5-8Gb on 7k calls - it may be caused by some memory leaks in old version.

this is how it should be on 9.5k calls. 7366mb VmRSS

Ohh thanks for the update

I see SEMS Log giving a lot of these:
Please anything you think I might need to adjust?

May 11 08:12:27 yeti52 sems[51742]: [52226/yeti:SqlRouter.cpp:383] ERROR: SQL cant get profiles. Drop request
May 11 08:12:27 yeti52 sems[51742]: [52182/yeti:db/PgConnectionPool.cpp:190] WARNING: : timeout waiting for an active connection (waited 125ms)
May 11 08:12:27 yeti52 sems[51742]: [52182/yeti:SqlRouter.cpp:383] ERROR: SQL cant get profiles. Drop request
May 11 08:12:27 yeti52 sems[51742]: [52227/yeti:db/PgConnectionPool.cpp:190] WARNING: : timeout waiting for an active connection (waited 125ms)
May 11 08:12:27 yeti52 sems[51742]: [52227/yeti:SqlRouter.cpp:383] ERROR: SQL cant get profiles. Drop request
May 11 08:12:27 yeti52 sems[51742]: [52202/yeti:db/PgConnectionPool.cpp:190] WARNING: : timeout waiting for an active connection (waited 125ms)
May 11 08:12:27 yeti52 sems[51742]: [52202/yeti:SqlRouter.cpp:383] ERROR: SQL cant get profiles. Drop request
May 11 08:12:27 yeti52 sems[51742]: [52206/yeti:db/PgConnectionPool.cpp:190] WARNING: : timeout waiting for an active connection (waited 125ms)
May 11 08:12:27 yeti52 sems[51742]: [52206/yeti:SqlRouter.cpp:383] ERROR: SQL cant get profiles. Drop request
May 11 08:12:27 yeti52 sems[51742]: [52194/yeti:db/PgConnectionPool.cpp:190] WARNING: : timeout waiting for an active connection (waited 125ms)
May 11 08:12:27 yeti52 sems[51742]: [52194/yeti:SqlRouter.cpp:383] ERROR: SQL cant get profiles. Drop request
May 11 08:12:27 yeti52 sems[51742]: [52221/yeti:db/PgConnectionPool.cpp:190] WARNING: : timeout waiting for an active connection (waited 125ms)
May 11 08:12:27 yeti52 sems[51742]: [52224/yeti:db/PgConnectionPool.cpp:190] WARNING: : timeout waiting for an active connection (waited 125ms)
May 11 08:12:27 yeti52 sems[51742]: [52224/yeti:SqlRouter.cpp:383] ERROR: SQL cant get profiles. Drop request
May 11 08:12:27 yeti52 sems[51742]: [52235/yeti:db/PgConnectionPool.cpp:190] WARNING: : timeout waiting for an active connection (waited 125ms)
May 11 08:12:27 yeti52 sems[51742]: [52235/yeti:SqlRouter.cpp:383] ERROR: SQL cant get profiles. Drop request
May 11 08:12:27 yeti52 sems[51742]: [52221/yeti:SqlRouter.cpp:383] ERROR: SQL cant get profiles. Drop request
May 11 08:12:27 yeti52 sems[51742]: [52211/yeti:db/PgConnectionPool.cpp:190] WARNING: : timeout waiting for an active connection (waited 125ms)

Postgres Logs shows

2022-05-11 21:15:16.482 UTC,"yeti","yeti",23052,"127.0.0.1:43062",627c2764.5a0c,1,"SELECT",2022-05-11 21:15:16 UTC,38/6,0,WARNING,01000,"Adding LNP resolvers sockets: <NULL>. Resolver timeout: 1000ms",,,,,"PL/pgSQL function init(integer,integer) line 7 at RAISE",,,,""
2022-05-11 21:15:16.498 UTC,"yeti","yeti",23054,"127.0.0.1:43064",627c2764.5a0e,1,"SELECT",2022-05-11 21:15:16 UTC,39/6,0,WARNING,01000,"Adding LNP resolvers sockets: <NULL>. Resolver timeout: 1000ms",,,,,"PL/pgSQL function init(integer,integer) line 7 at RAISE",,,,""
2022-05-11 21:15:16.514 UTC,"yeti","yeti",23056,"127.0.0.1:43066",627c2764.5a10,1,"SELECT",2022-05-11 21:15:16 UTC,40/6,0,WARNING,01000,"Adding LNP resolvers sockets: <NULL>. Resolver timeout: 1000ms",,,,,"PL/pgSQL function init(integer,integer) line 7 at RAISE",,,,""
2022-05-11 21:15:16.531 UTC,"yeti","yeti",23058,"127.0.0.1:43068",627c2764.5a12,1,"SELECT",2022-05-11 21:15:16 UTC,41/6,0,WARNING,01000,"Adding LNP resolvers sockets: <NULL>. Resolver timeout: 1000ms",,,,,"PL/pgSQL function init(integer,integer) line 7 at RAISE",,,,""
2022-05-11 21:15:16.547 UTC,"yeti","yeti",23060,"127.0.0.1:43070",627c2764.5a14,1,"SELECT",2022-05-11 21:15:16 UTC,42/6,0,WARNING,01000,"Adding LNP resolvers sockets: <NULL>. Resolver timeout: 1000ms",,,,,"PL/pgSQL function init(integer,integer) line 7 at RAISE",,,,""
2022-05-11 21:15:16.563 UTC,"yeti","yeti",23062,"127.0.0.1:43072",627c2764.5a16,1,"SELECT",2022-05-11 21:15:16 UTC,43/6,0,WARNING,01000,"Adding LNP resolvers sockets: <NULL>. Resolver timeout: 1000ms",,,,,"PL/pgSQL function init(integer,integer) line 7 at RAISE",,,,""
2022-05-11 21:15:16.578 UTC,"yeti","yeti",23064,"127.0.0.1:43074",627c2764.5a18,1,"SELECT",2022-05-11 21:15:16 UTC,44/6,0,WARNING,01000,"Adding LNP resolvers sockets: <NULL>. Resolver timeout: 1000ms",,,,,"PL/pgSQL function init(integer,integer) line 7 at RAISE",,,,""
2022-05-11 21:15:16.592 UTC,"yeti","yeti",23066,"127.0.0.1:43076",627c2764.5a1a,1,"SELECT",2022-05-11 21:15:16 UTC,45/6,0,WARNING,01000,"Adding LNP resolvers sockets: <NULL>. Resolver timeout: 1000ms",,,,,"PL/pgSQL function init(integer,integer) line 7 at RAISE",,,,""
2022-05-11 21:15:16.607 UTC,"yeti","yeti",23068,"127.0.0.1:43078",627c2764.5a1c,1,"SELECT",2022-05-11 21:15:16 UTC,46/6,0,WARNING,01000,"Adding LNP resolvers sockets: <NULL>. Resolver timeout: 1000ms",,,,,"PL/pgSQL function init(integer,integer) line 7 at RAISE",,,,""
2022-05-11 21:15:16.622 UTC,"yeti","yeti",23070,"127.0.0.1:43080",627c2764.5a1e,1,"SELECT",2022-05-11 21:15:16 UTC,47/6,0,WARNING,01000,"Adding LNP resolvers sockets: <NULL>. Resolver timeout: 1000ms",,,,,"PL/pgSQL function init(integer,integer) line 7 at RAISE",,,,""
2022-05-11 21:15:16.635 UTC,"yeti","yeti",23072,"127.0.0.1:43082",627c2764.5a20,1,"SELECT",2022-05-11 21:15:16 UTC,48/6,0,WARNING,01000,"Adding LNP resolvers sockets: <NULL>. Resolver timeout: 1000ms",,,,,"PL/pgSQL function init(integer,integer) line 7 at RAISE",,,,""
2022-05-11 21:15:16.651 UTC,"yeti","yeti",23074,"127.0.0.1:43084",627c2764.5a22,1,"SELECT",2022-05-11 21:15:16 UTC,49/6,0,WARNING,01000,"Adding LNP resolvers sockets: <NULL>. Resolver timeout: 1000ms",,,,,"PL/pgSQL function init(integer,integer) line 7 at RAISE",,,,""

connection pool size too small

these logs are useless. Query log required to check routing performance

also if you are using prometheus, share
max(rate(sems_core_session_processor_events_time_spent_ms[5m])/rate(sems_core_session_processor_events_count[5m]) ) by (type)
and rate(sems_yeti_router_db_hits_time[5m])/rate(sems_yeti_router_db_hits[5m]) charts